Grade B Evaluation (EV)
Live Bird & Processing Quality — Jan to May 2026
43.8% Defect Rate — CRITICAL
CRITICAL: Defect Rate 2x Above Target
Defect rate consistently ~44-50%, far above the 20% target. Best month was May at 43.8% but still more than double the target. Waziyah farm cluster is the biggest contributor.
Defect Rate (May)
43.8%
Target
≤20%
Inspected (May)
7,129
Defects (May)
3,124
Gap to Target
23.8pp
Defect Rate Trend
Top Defect Types (May)
Top Farms by Defects (May)
Defect Origin: Farm vs PPP
~45%
Farm Origin
Bruises, Scratches, Scabby Hips
~55%
PPP Origin
Broken Bones, Feathers
Monthly Volume
| Month | Inspected | Defects | Defect Rate |
|---|---|---|---|
| January | 14,457 | 7,218 | 49.9% |
| February | 8,671 | 4,076 | 47.0% |
| March | 17,448 | 8,700 | 49.9% |
| April | 8,557 | 4,060 | 47.4% |
| May | 7,129 | 3,124 | 43.8% |
Required Actions
- • Waziyah farm cluster (3, 4, 7) — major defect contributor — farm audit needed immediately
- • Al Qahtany farm cluster (1, 2) — second largest contributor — training program required
- • Bruises and broken bones account for ~60% of all defects
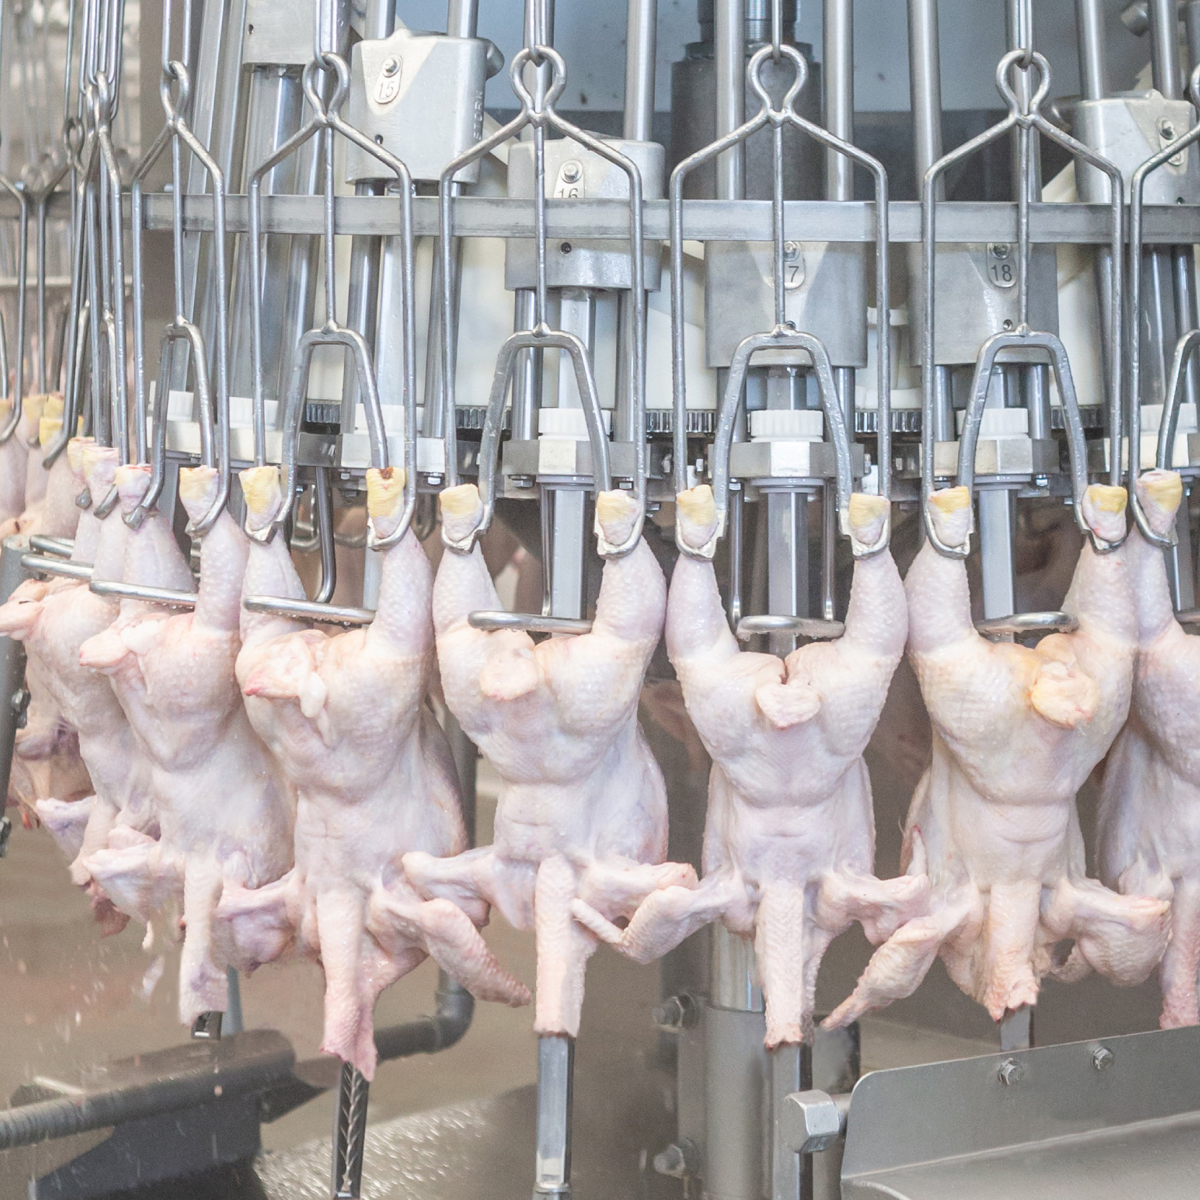
- • PPP-origin defects — equipment/process review (shackle speed, plucking machines)
- • Farm-origin defects — live bird handling improvement at catching stage